QuantumBlack, AI by McKinsey
Tracking Performance of Machine Learning Models
2019 - 2020 · Product, UXD, UXR, UI, Design Ops
It is no longer enough to deliver insights from data. Organisations need ML and AI that scales and reduces risks.
Brief
As businesses increasingly base decisions on ML model outputs, how might we ensure the model continues to perform as expected? How might we build trust, reliability, and explainability into the model development process?
Role
Building on foundational visual work by Gabriel Comym, I became the sole Product Designer. I also co-led the strategic development together with PM Jessica Fan. In these functions, I contributed to the entire product development process focussing on research, design, and operations.
Outcome
The API driven python library and interactive data exploration tool we developed has attracted new clients and accelerated engagements, leading to savings and revenues of several million pounds. My research outcomes and methods have been used across the product organisation.
Reframe
Pivoting towards User-centred product development
Prior to my joining the project, the team had taken an engineering-first approach to developing data science packages. This resulted in a lack of usability, integration into existing workflows, and adoption. I proposed revisiting fundamental assumptions to identify and define a target user, understand their end-to-end workflow, pain points, and business requirements, and develop a set of testable hypotheses for value creation. This allowed us to develop an exciting long-term vision and identify a specific set of user problems which we could solve quickly
Research
Mapping performance tracking through the ML Model development and deployment cycle
A two-week discovery sprint solidified the team’s understanding of the model development process in practice, and let me identify touchpoints relevant to model performance tracking. This involved conducting dozens of interviews with colleague Data Scientists and Data Engineers, getting their input on an evolving process map.
Key insight:
To establish performance tracking in production, tracking needed to already be in place earlier in the development process, during the experimentation phase.
We needed a pivot towards initially serving experiment tracking even though live model performance monitoring was the ultimate goal.
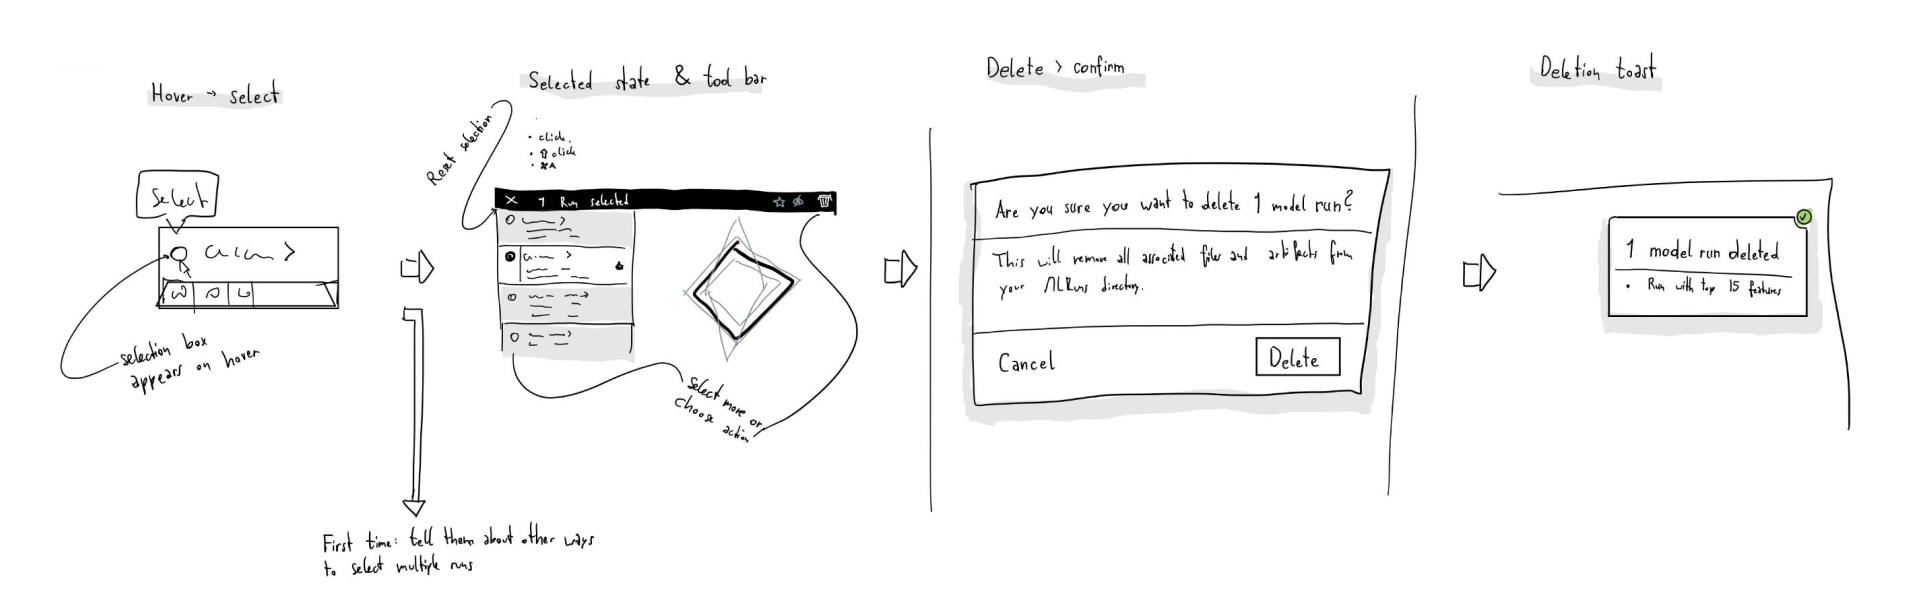
Information Architecture and Wireframing
Designing User journeys across flows, views, and interactions
In a small team, I think through drawing collaboratively and iteratively. This leads to less time spent on documentation and clean wireframes, and allows for more rapid iteration. Constantly testing designs with users, I moved through levels of complexity:
Process map (see above)
User flows
Individual views
Interactions and micro-interactions
Key insight: As experimentation is such a rapid process, users needed to instantly glance changes between model runs in the primary view without much clicking between pages.

Data Visualisation design
Exploring the visualisation of vast numbers of model runs
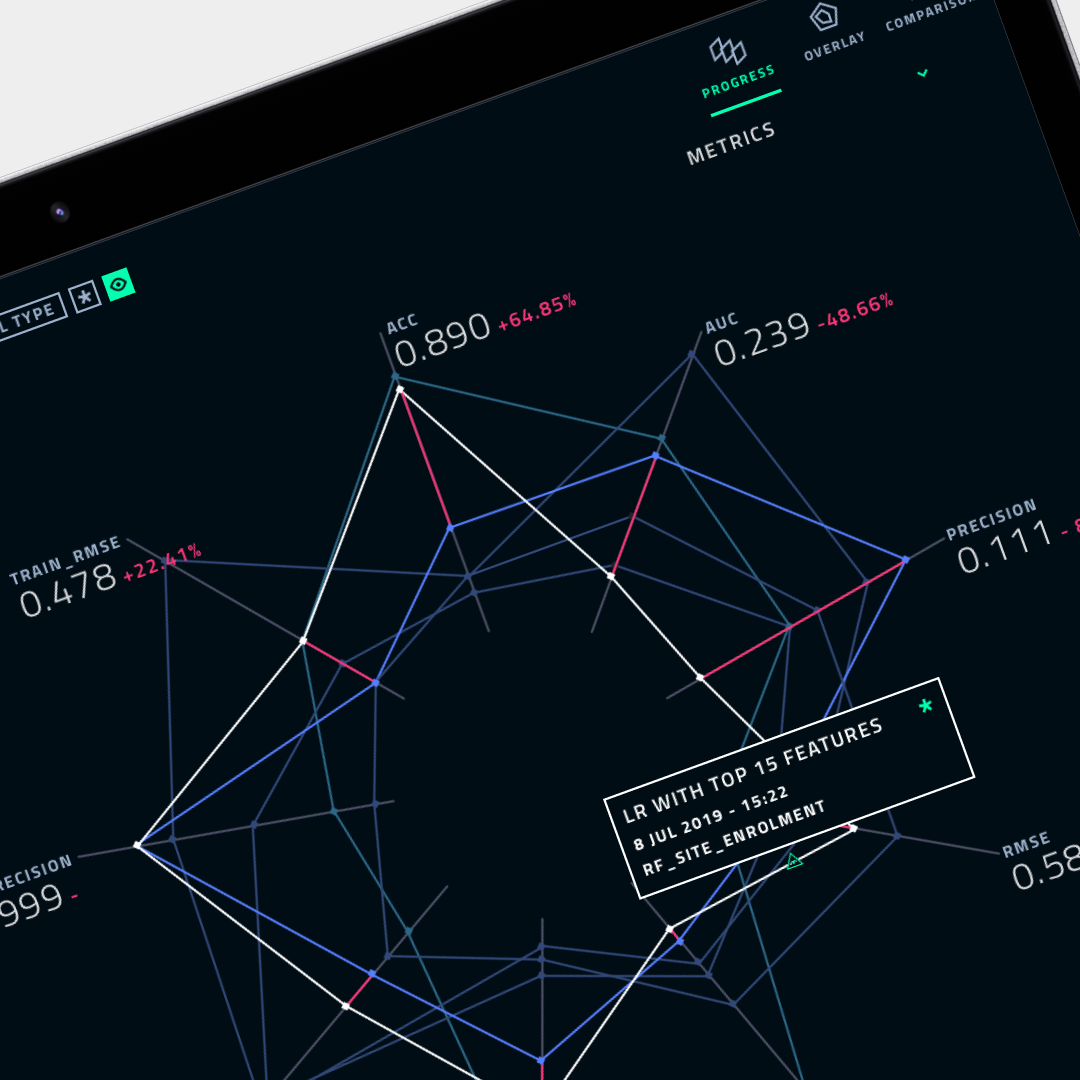
Advanced analytics practitioners had to understand changes in model perfor-mance over time through a multitude of metrics. Creating an intuitive visualisa-tion to this end became a key design challenge - and the core element of the application. I explored this by gathering examples and iterating on concepts of my own creation in 2D and 3D.
Key insight: With too many metrics to parse at the same time, users were more comfort-able with designs that let them track the general ‘shape’ of a model run, rather than display all numeric values at once.
This opened the door to a less complicated interactive type of visualisation.
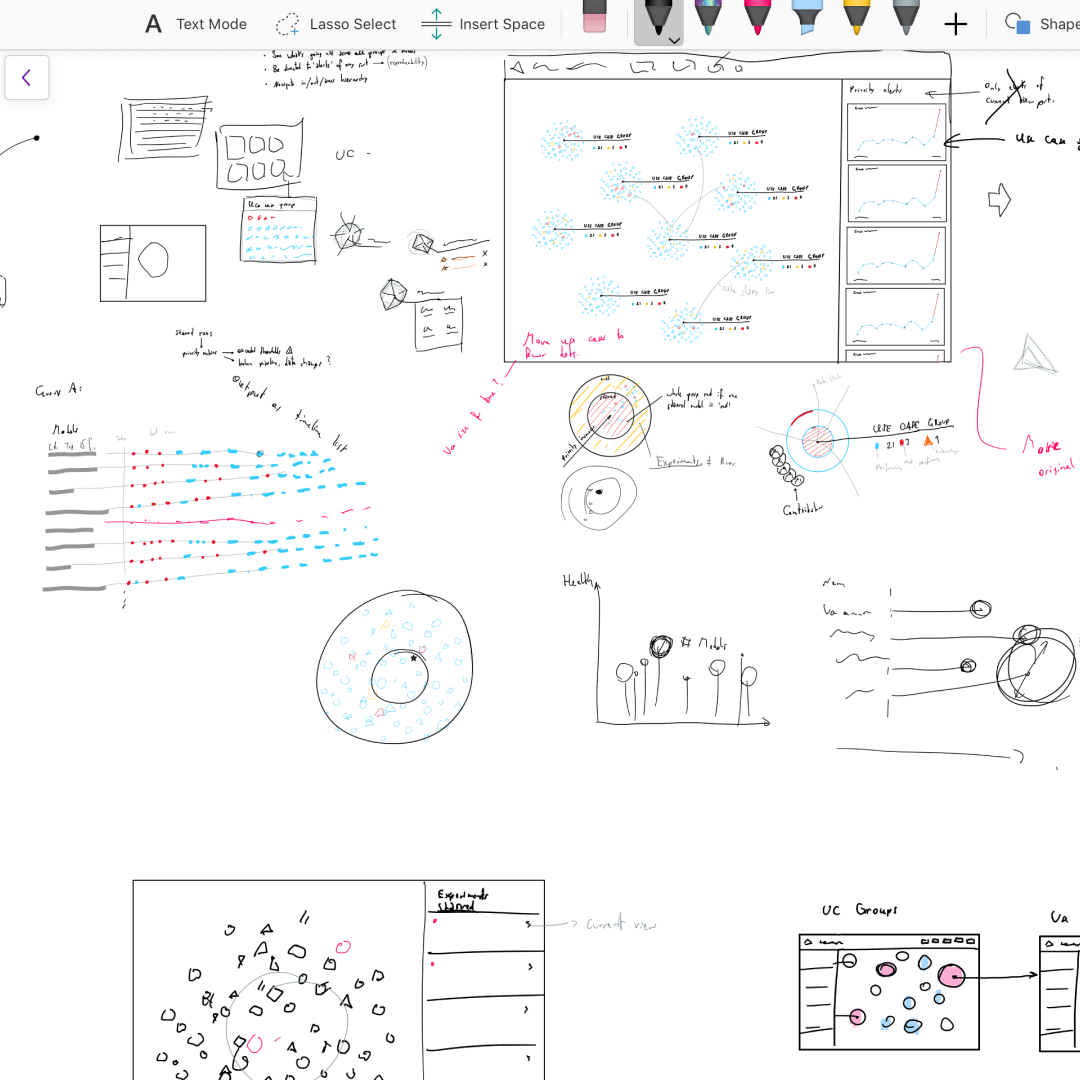
Ideation
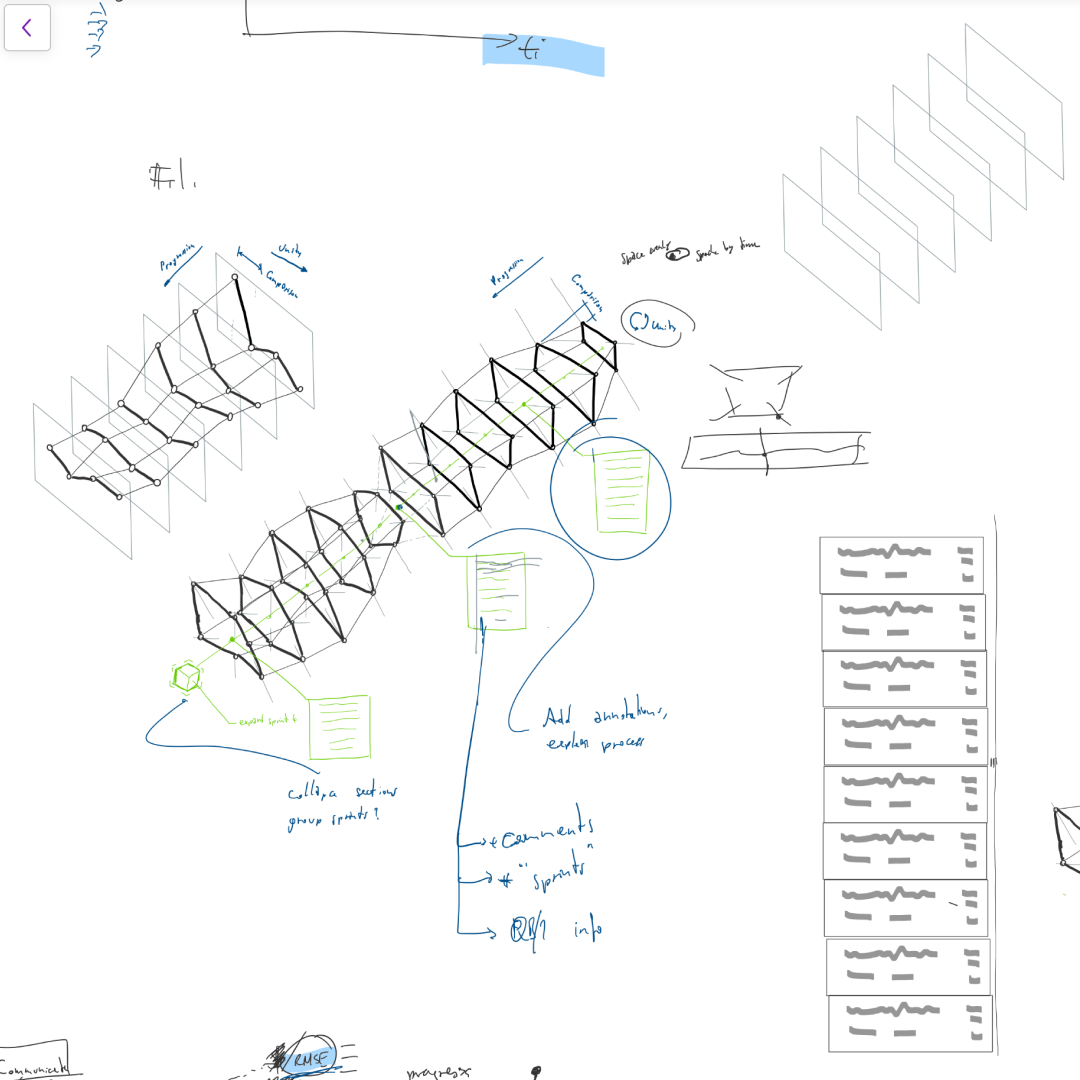
Early design sketches of the main visualisation

Inspiration board
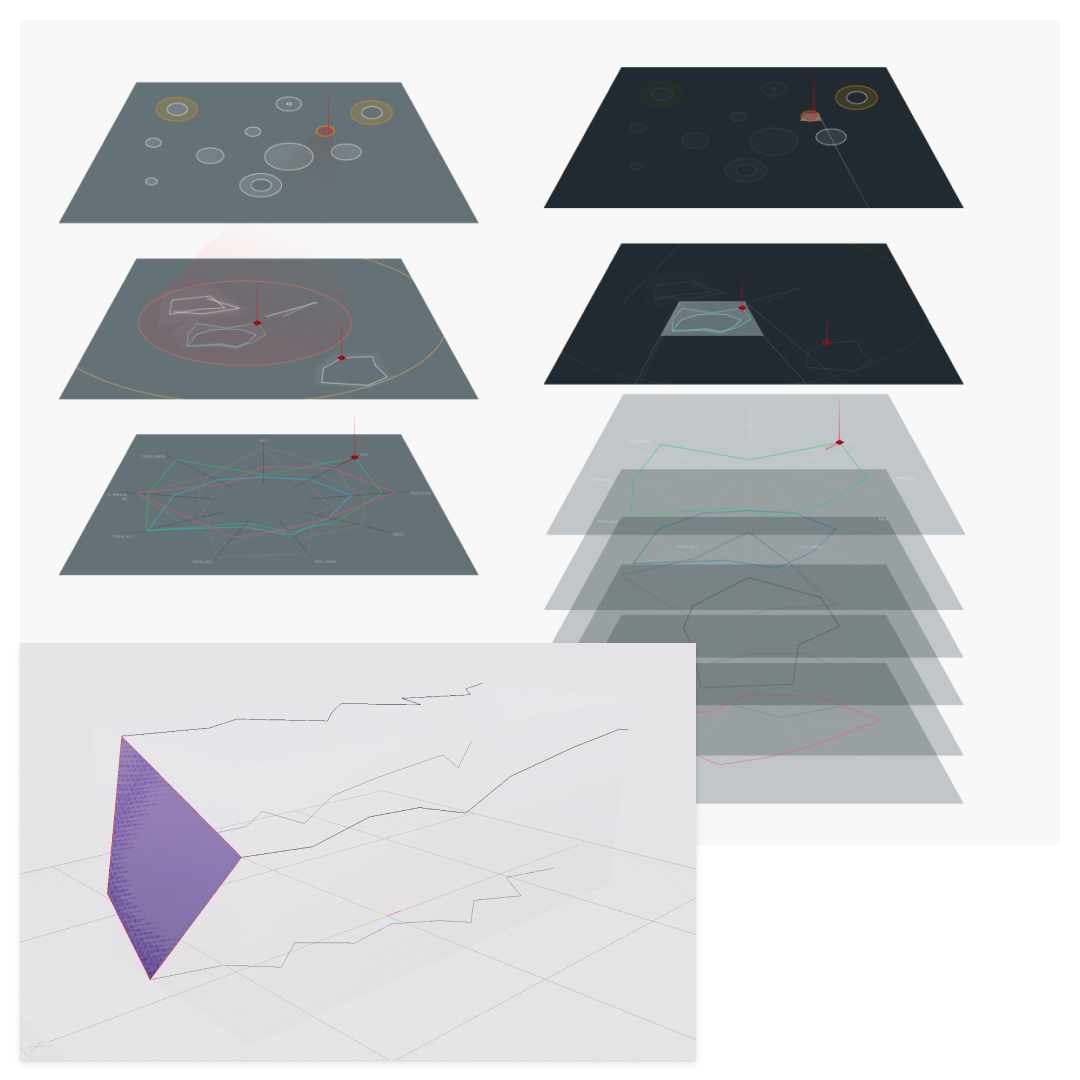
Experiments in 3D
Concept sketch showing comparison of two model runs in an isometric 3D visualisation
Solution
A lightweight library for tracking experiment runs and monitoring model performance
PerformanceAI helps analytics practitioners to focus on unique modelling challenges, embed best practice on projects, and deliver a risk-free solution for McKinsey’s and QuantumBlack’s clients. It does this by:
Tracking model performance over time in an interactive dashboard that focuses on changes of metric values between each run and helps to identify patterns
Implementing performance shift detection that uses an array of advanced analytical and machine learning methods
Alerting end users when performance has degraded beyond acceptable limits
Providing solutions to help fix performance issues
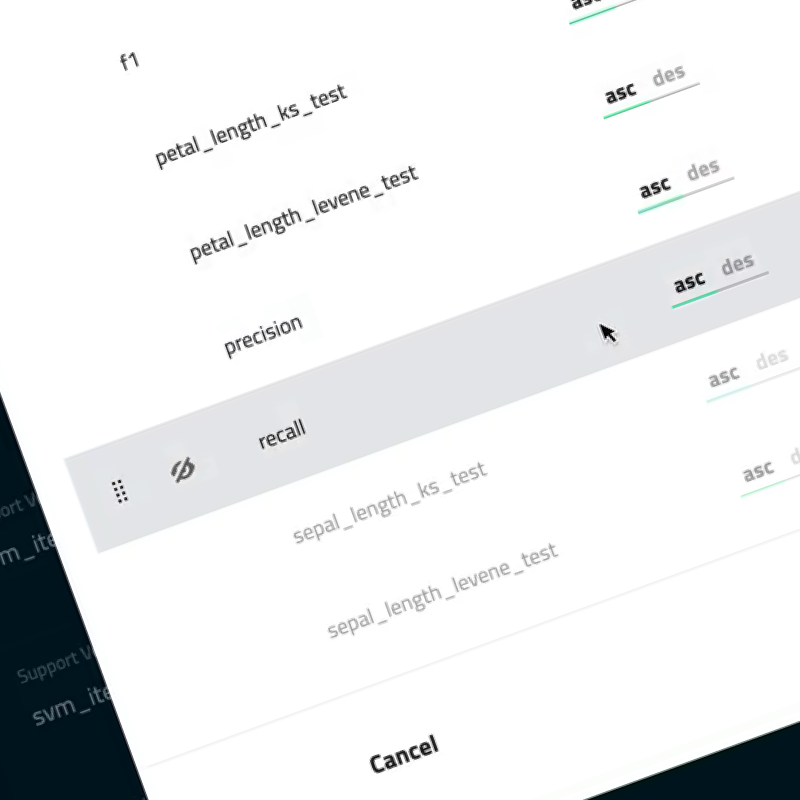
Below are screenshots of the actual app in its demo environment.


In addition to ‘serious’ features, I created various fun easter eggs which I implemented together with the engineering lead as a side project. User analytics showed that these easter eggs were some of the most used effective drivers for adoption and engagement overall. They also helped spread a light-hearted company culture.
Outcomes
Creating a Legacy Beyond Internal Use
After being deployed on almost every client project as an individual tool, PerformanceAI was ultimately absorbed into Kedro to combine model experiment tracking with data pipeline management. Kedro is McKinsey’s first Open Source project enjoying top rankings on Github. It officially joined the Linux foundation in 2022.
£MMs
Saved by accelerating and de-risking ML Model development
dozens
Proposals won that included model performance tracking
100+
Deployments on client projects after one year
8 k
Stars on Github for Kedro, into which PAI was absorbed