There’s a whole science to customer or user satisfaction measurement. But sometimes, you just want to get started quickly. This is how to do it ‘safely’.

f course, there isn’t just one way. There are as many as there are different types of products or services. But you’re not here to get a degree in customer experience measurement. You’re here to get started, quickly, with a straightforward answer. I’ll tell you what has worked for me in most circumstances over the past decade and why this is a great way to get started. Then I’ll share a few other methods and why they are worth considering.
The one solution: “Satisfaction Score Plus”
For this way of measuring customer or user satisfaction, you’ll want to ask two questions:
How satisfied are you with [product/service]?
(mandatory 5-point multiple choice question)Very unsatisfied
Somewhat unsatisfied
Neither satisfied nor unsatisfied
Somewhat satisfied
Very satisfied
[Question two changes depending on the response to the above]
(optional free-form text input)What do you enjoy most about [product/service]?
(for those who responded positively)How could [product/service] be improved?
(for all other responses)
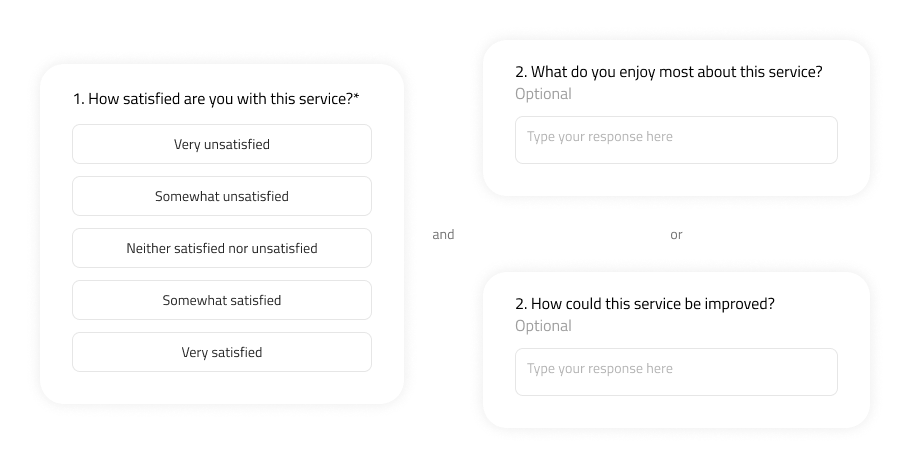
In the vast majority of instances, users won’t answer the second question as text inputs require some of the highest cognitive load. Hence, it’s essential to keep the second question optional to avoid survey abandonment.
Satisfaction Score Plus (I made this up, but in the hopes of it becoming a thing, please call it SSP) ticks a variety of boxes. These - I dare say - will be helpful to most teams who are just starting out with measuring their product’s user experience. Amongst other benefits, it…:
works for low sample sizes or respondent numbers
provides a metric that can be tracked over time that is relevant to business and product teams alike
leaves space for open exploration i.e. helps you to uncover ‘unknown unknowns’ about your product and users through the text input. You can then build a qualitative user research study around these responses to improve your product.
is low-friction for users
is easy to analyse for your team
is easy to implement with off-the-shelf (and free) tools such as Hotjar. This enables you to survey users while they are engaging with your product (rather than afterwards) and without having to steal engineering time to deploy your questionnaire.
The other “one solution”: Actual Net Promoter Score (aNPS)
The Net Promoter Score - or NPS - has become synonymous with measuring the success of a business or service. Indeed it should be credited for helping to transition mindsets from pure business metrics towards user experience metrics that demonstrate more empathy for customers and an appreciation for capturing this in addition to hard numbers (mostly in monies). The NPS asks “How likely would you be to recommend [product/service] to a friend or colleague?”
The NPS has two problems:
Firstly, most teams use it in isolation, only asking that one question to get a trackable number. I’ve not found this to be particularly useful. Implementing the NPS properly can yield excellent results, but is a lot more complex than just asking one question.
Secondly, the NPS asks customers to anticipate their future behaviour. However, it has been shown time and time again that this is something humans are notoriously terrible at.
This is why I prefer to ask about past behaviour instead of using the Actual Net Promoter Score. It works the same way as the NPS, except you’ll now ask:
DID YOU recommend [product/service] to a friend or colleague in the past [time frame]?
This score will likely be lower than the NPS or SSP, but it will be much more accurate. Another plus of this is that if you build a referral programme into your service, you’ll get this metric for free just by looking into your analytics. Note that, as with the NPS, you will need much higher respondent rates than for the SSP - at least 50 to 100.
How to measure user experience properly? Start with these questions
Now that we’ve gone through these quick-start options for you to dive in with, I should point out that thoroughly implementing user experience measurement across your service is much more complex. In all brevity, when I approach this topic anew, I’ll ask myself (and my team) these questions:
Do we actually want to measure satisfaction or performance? Teams often get confused between UX indicators, technical performance, and business metrics. In short - one helps the team to get signals on how to deliver the best experience, the others help identify how well your product is functioning and serving the business. I’ve rarely found them to be the same.
Do we just need a metric to track or a diagnostic tool to figure out how to improve our product?
Do we need an “absolute” one-time measurement or something more nuanced to establish a baseline and then try to improve it?
How many responses do we expect (for example, NPS/aNPS are utterly useless for small sample sizes as they discard a large chunk of the answers)?
Can we measure what we need without bothering our users with a survey (e.g. using analytics to track task success, returning users, etc.)?
Then, depending on the answers to these questions, I’d dig into the available options well documented by NielsenNorman and other sources.


